Sorting Hat
An automated course allocation program for Lewis & Clark College
09 December 2019
SortingHat is a program designed to eliminate headaches and save time when assigning students to classes.
There are two versions of SortingHat:
- SortingHat 1.0 - the original, delivered as a .JAR app (github repo)
- SortingHat 2.0 - a refresh, delivered as a webapp (github repo)
SortingHat 1.0
A version of this program was constructed in Spring 2018 by Lars Mayrand, Nick Tan, Mack Beveridge, Sam Peers, James Tostado, and I in a Software Development class at Lewis & Clark College. The application was built in Java and would allocate freshmen into their Exploration & Discovery (E&D) courses based on the following factors:
- Students must get one of their top three or four choices
- No class should have more students than a specified limit
- No student can take a course with a professor they’ve already had
- Gender ratios should be somewhat balanced in each class
- Athlete ratios should be somewhat balanced in each class
The thresholds for some factors (top choices, gender ratios, athlete ratios) were determined after meetings with the client. Other factors, such as the maximum class size for a given course, were provided in a csv file as inputs to the program. In addition, the program also had to account for students who had already been allocated a course manually and account for students who listed illegal course preferences.
The product delivered to Lewis & Clark College upon the end of the Spring 2018 term was able to allocate 500+ students to E&D sections in less than a tenth of a second while satisfying all of the above requirements. Previously this task took our client over a week to complete each semester. This version of SortingHat has been used every semester since Spring 2018.
See the github repo for SortingHat 1.0.
SortingHat.org
The primary goal with SortingHat 2.0 is to increase the flexibility of the program and make up for some of the shortcomings of SortingHat 1.0 so that it can be used to greater effect by Lewis & Clark College and eventually other academic institutions.
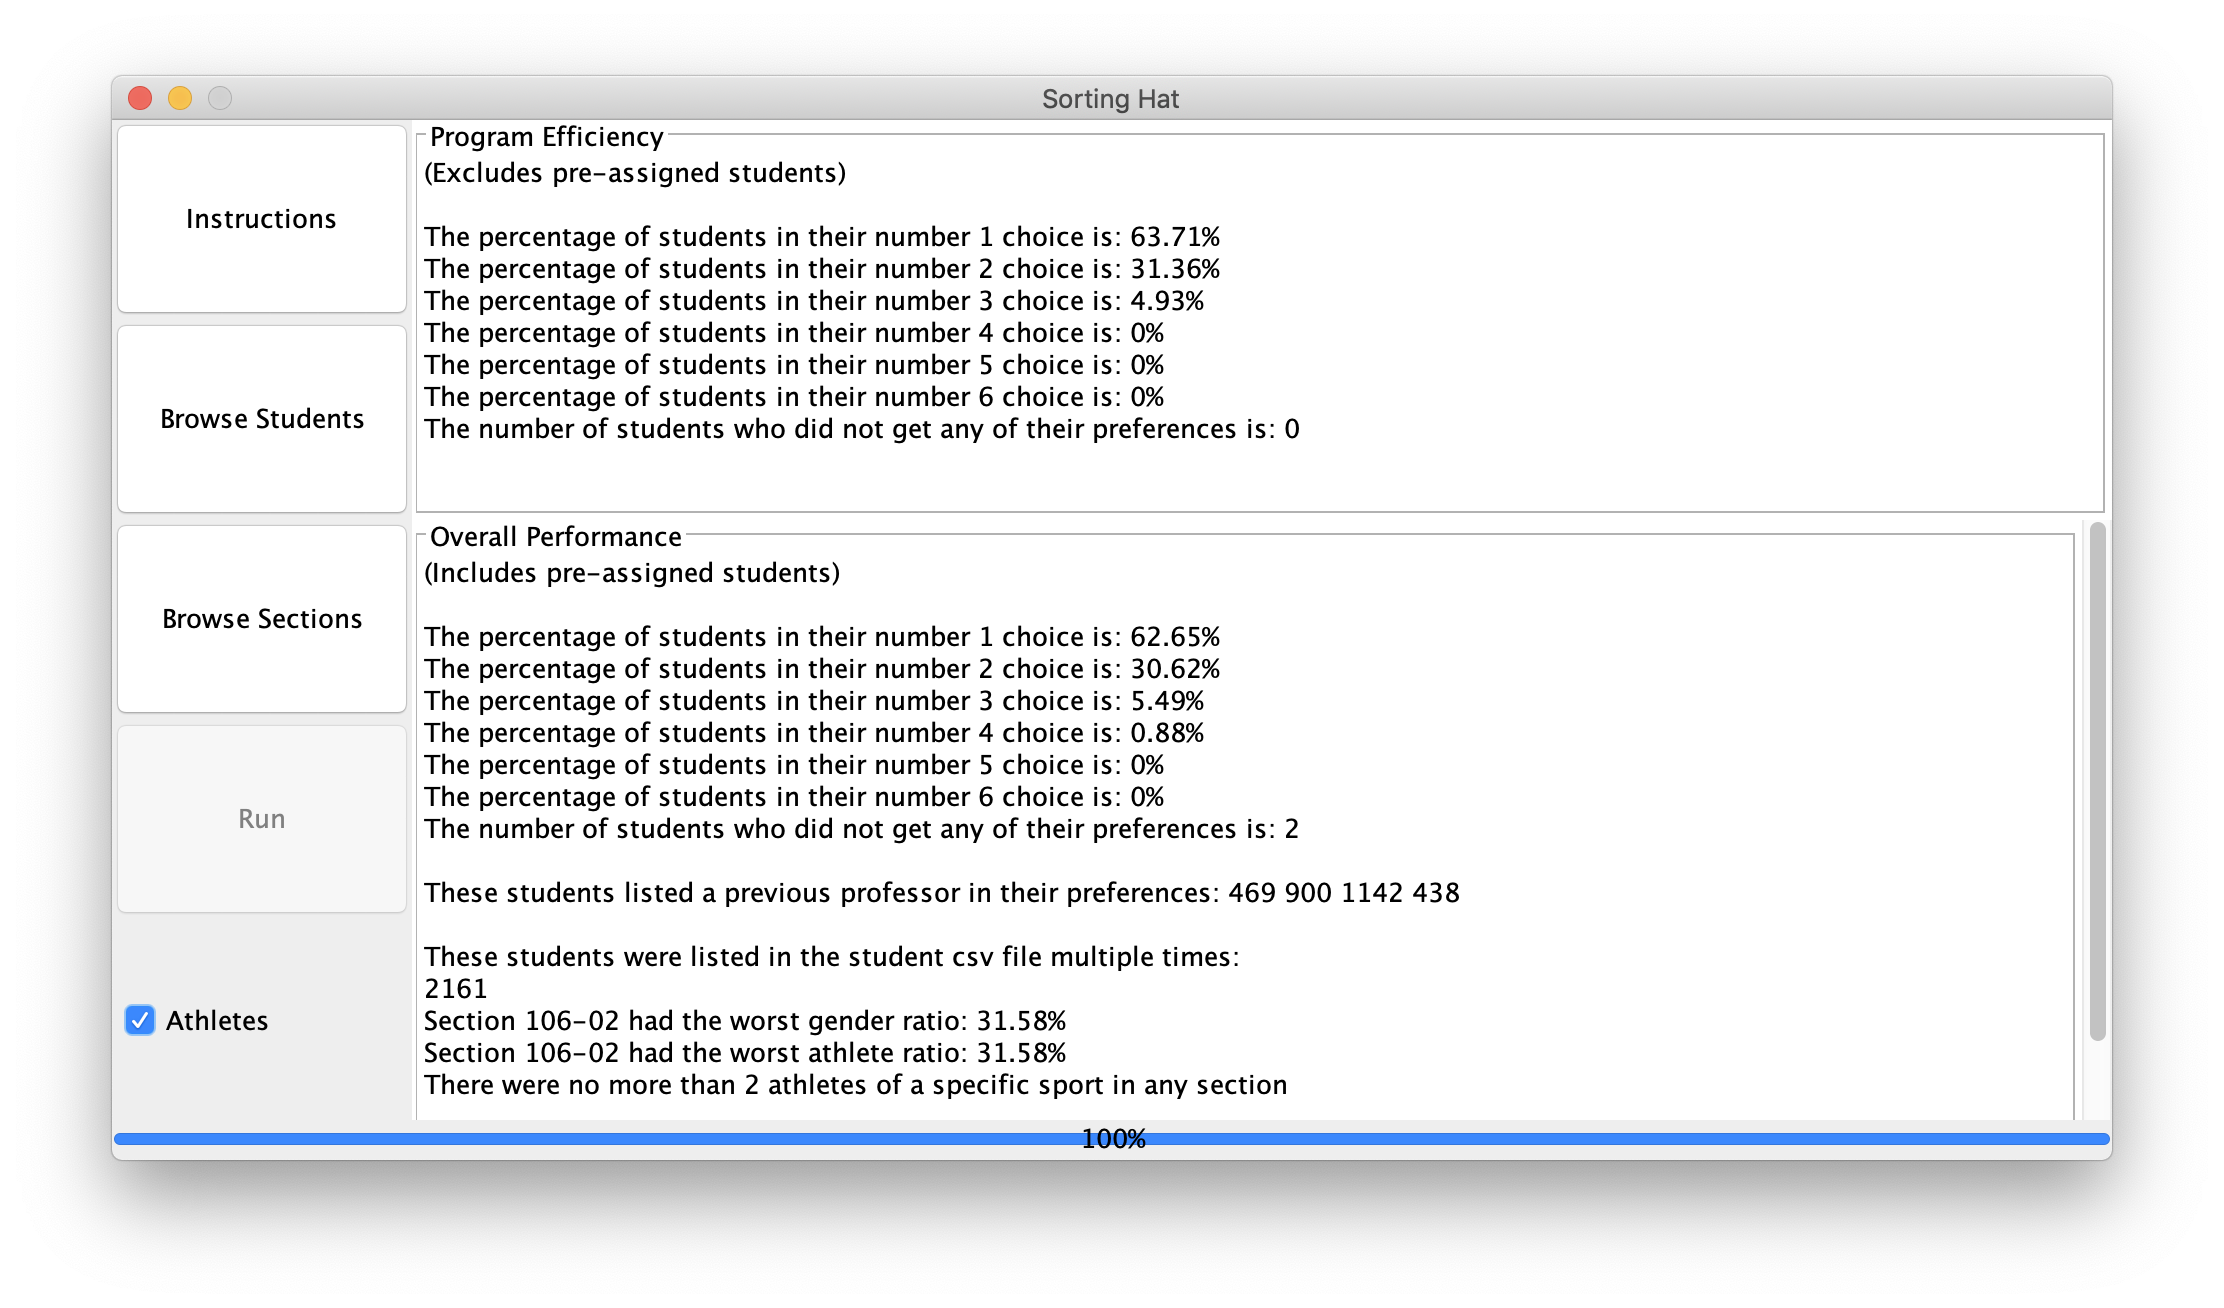
To make this more accessible, I rewrote the project in Javascript (fixing some bugs along the way), and completely redesigned the graphical user interface. I added sliders to improve flexibility of controlling existing parameters, documentation and more clear instructions about the program’s input specifications, and made graphs to help the user digest some of the stats about their student population.
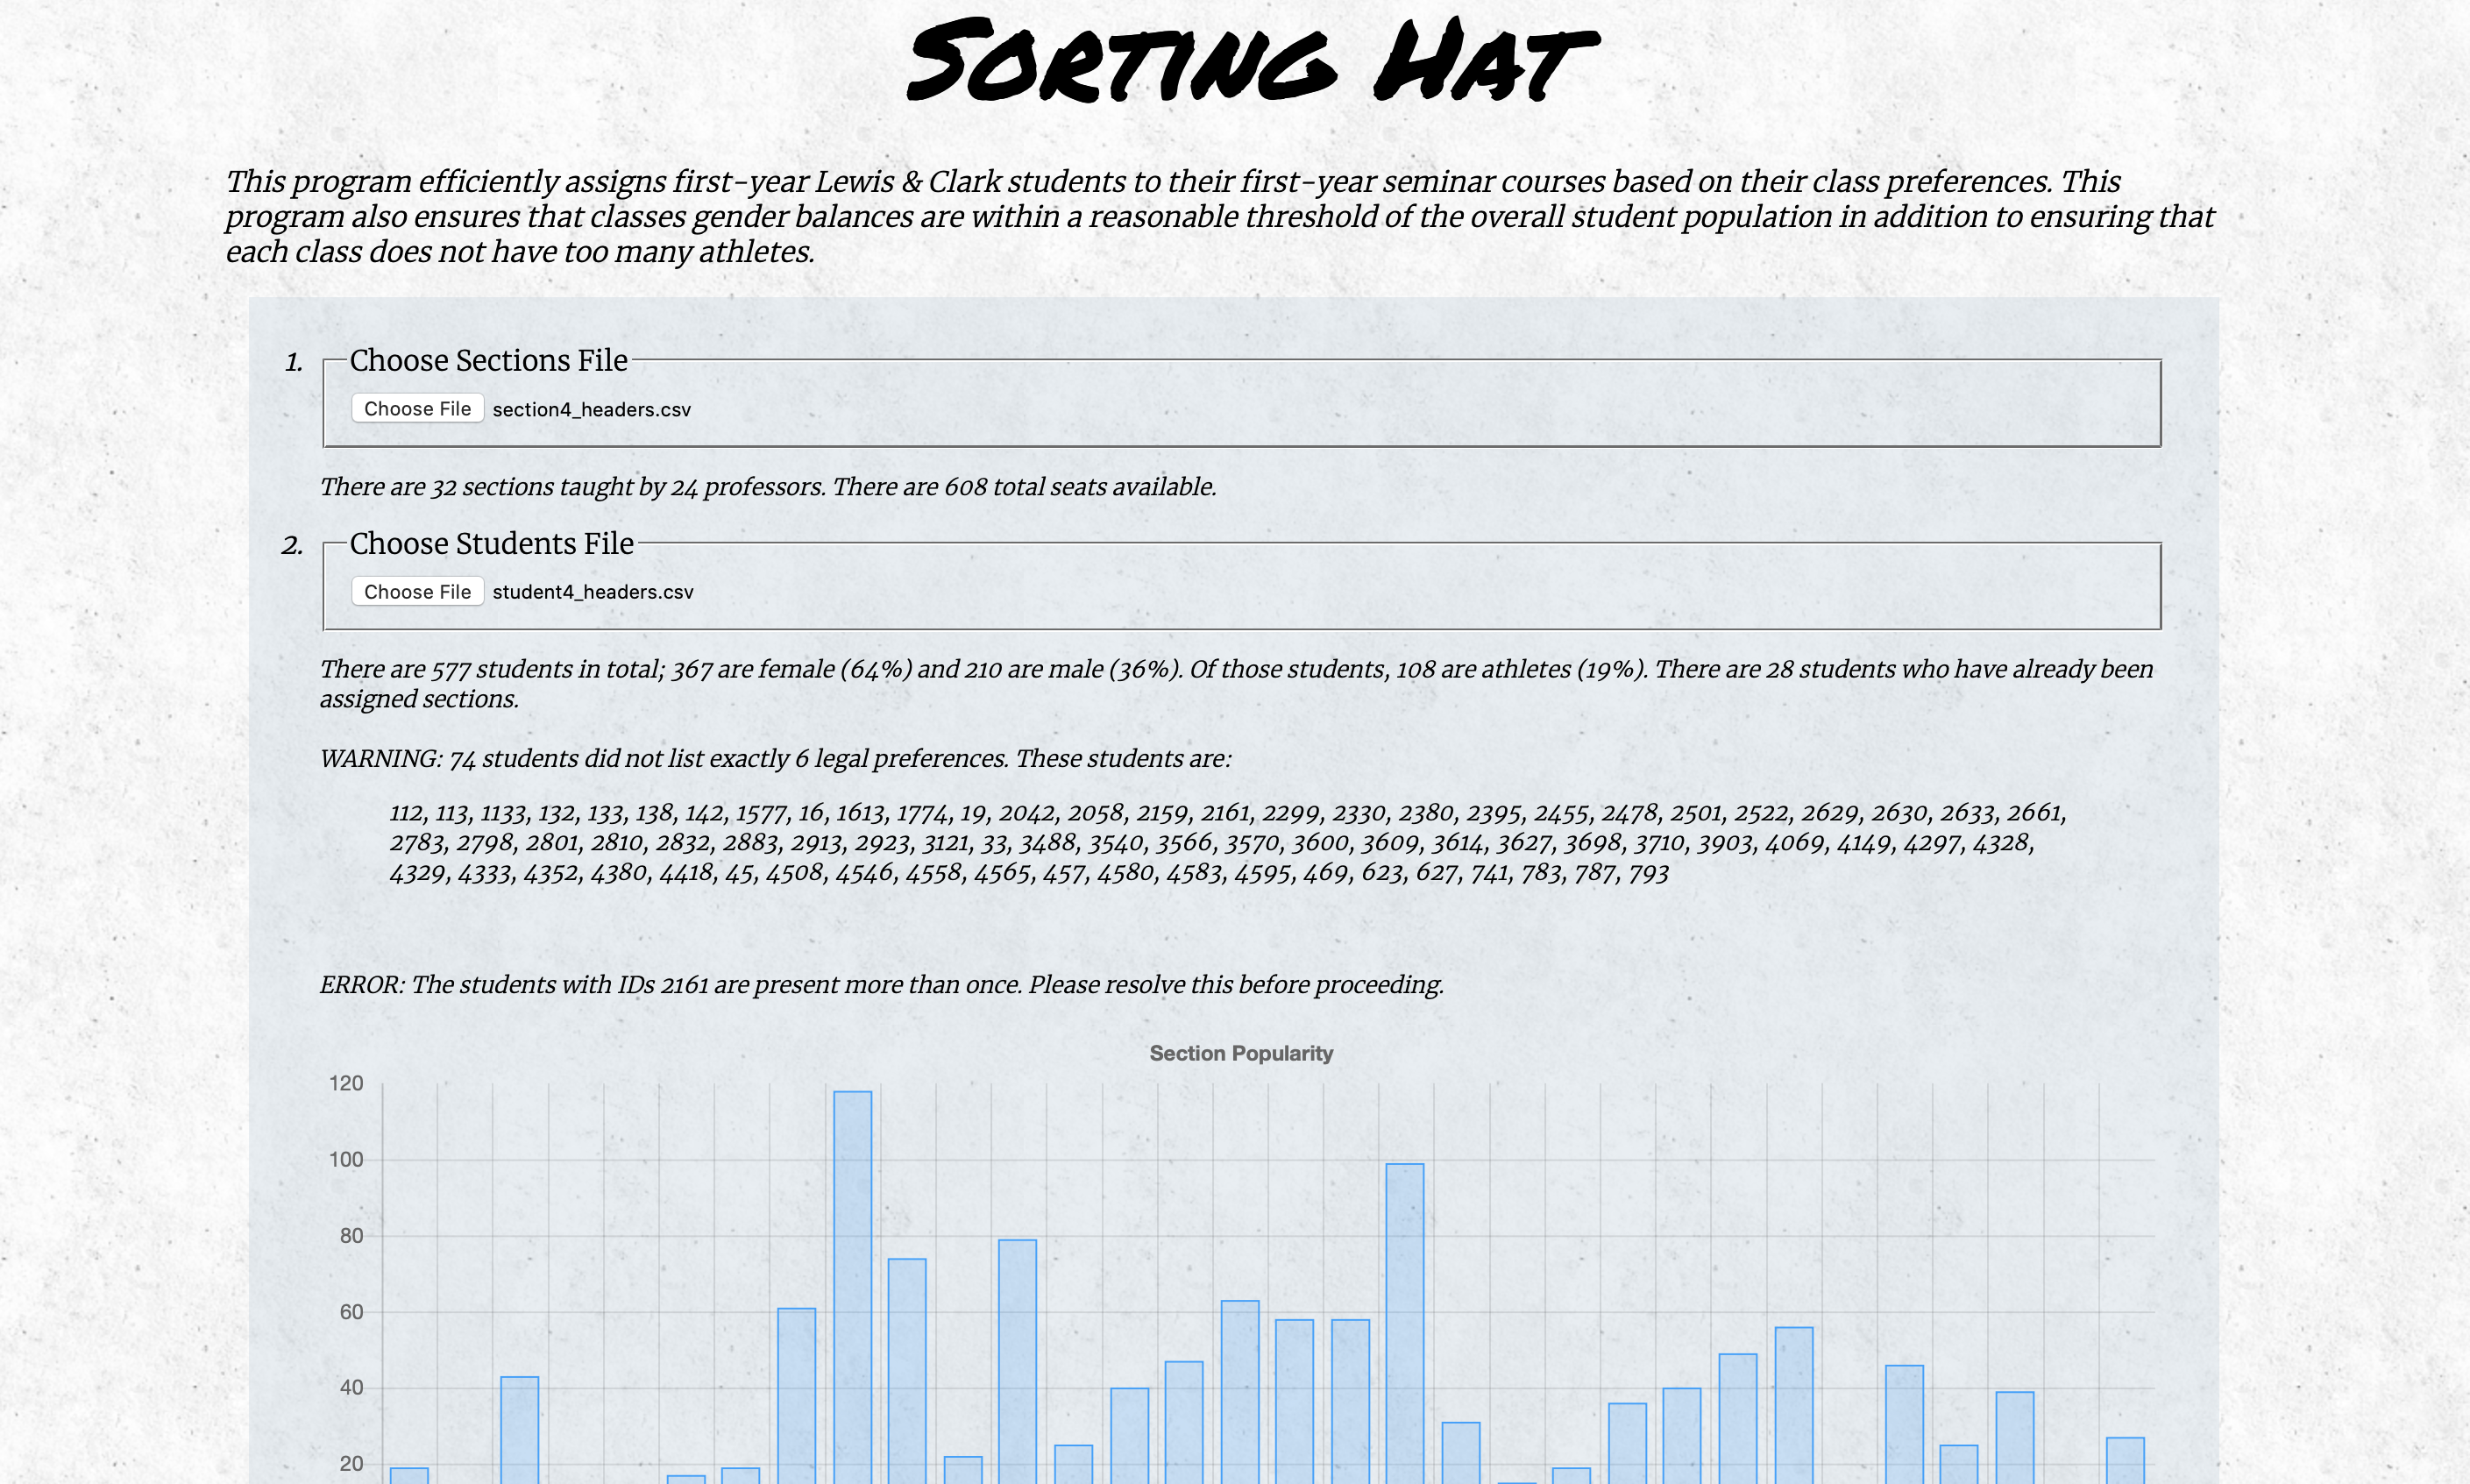
For example, the following chart is generated immediately after the user uploads the student csv file. It helps the user understand which sections are the most desirable to students:

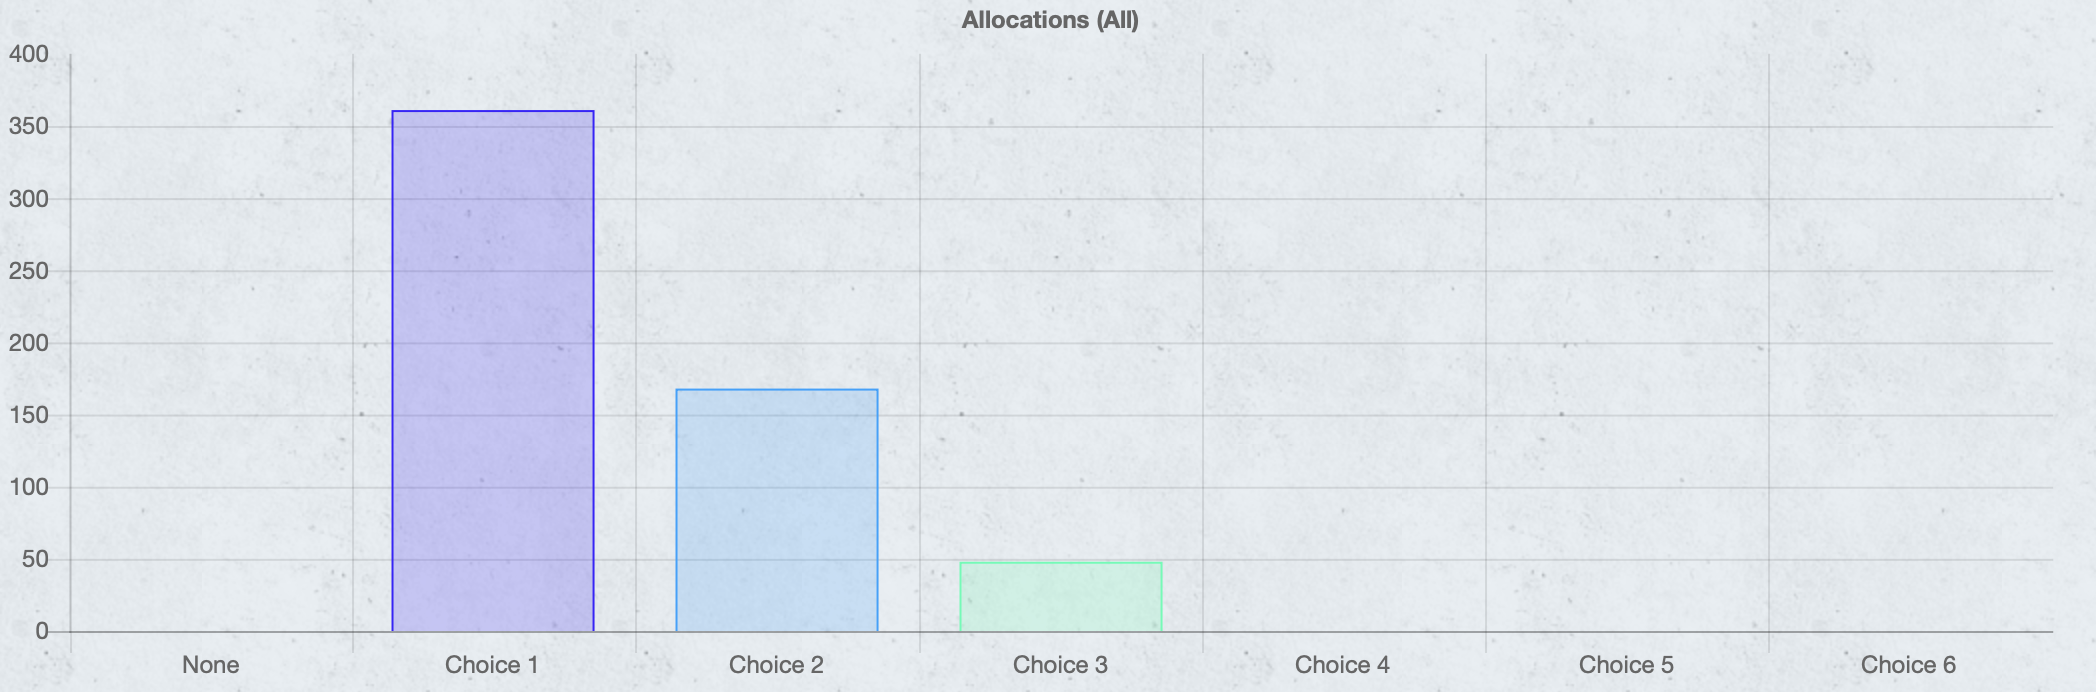
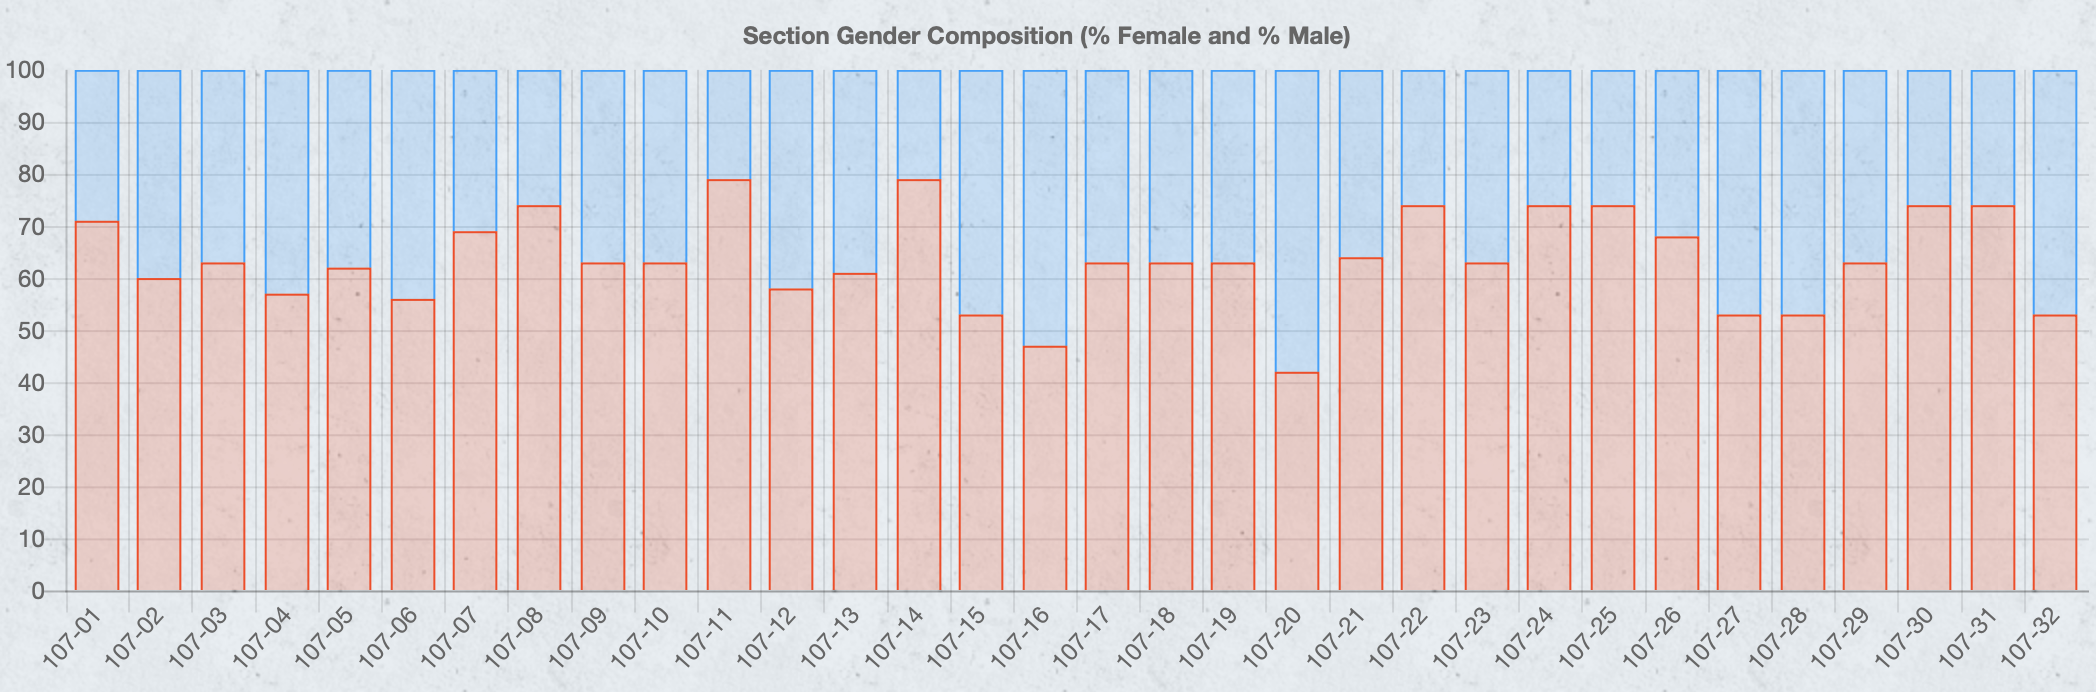
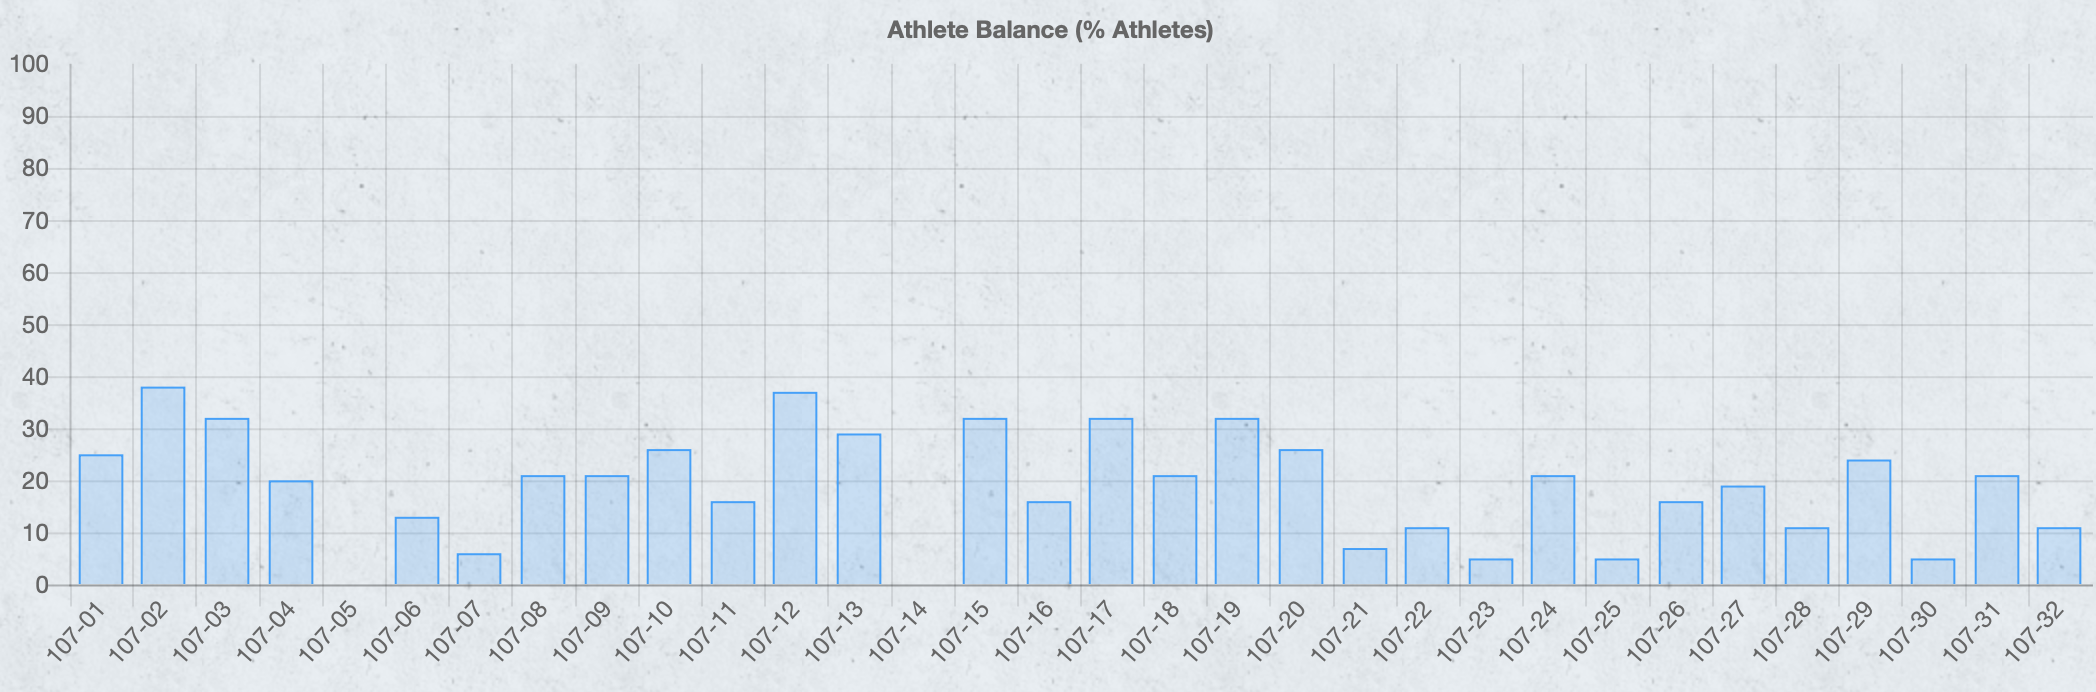
I also created graphics for Allocations, Gender Composition, and Athlete Balance which are drawn after the program is run.
Visit the github repo for the new SortingHat to read the documentation, browse the source code, or submit a pull request.
You can also visit maxwelllevin.com/sortinghat to see SortingHat live!