Sky
All-sky image segmentation with a convolutional neural network
01 June 2019
This was a three-semester (one full year) project involving a peer of mine (Zoe Harrington) and three advisers (Peter Drake, Jessica Kleiss, and Erin Riley).
Check out our Github Repo for more details.
About
Clouds are pretty, interesting, and play an important role in our global climate system. In addition, clouds are the largest source of uncertainty in climate model projections (Boucher et al. 2013). Our work takes aim at one area of uncertainty regarding clouds; visual image detection of clouds. By training a convolutional neural network to semantically segment whole-sky images of clouds we are able to extract information about the percentage of clouds in the observable sky, a statistic useful in weather forecasting, climate model development, and solar energy forecasting.
Data
There are already instruments/systems in place to segment photos of the sky with a decent level of accuracy. One such instrument, the total sky imager (TSI), is relatively cheap and is widely used around the world for this purpose.
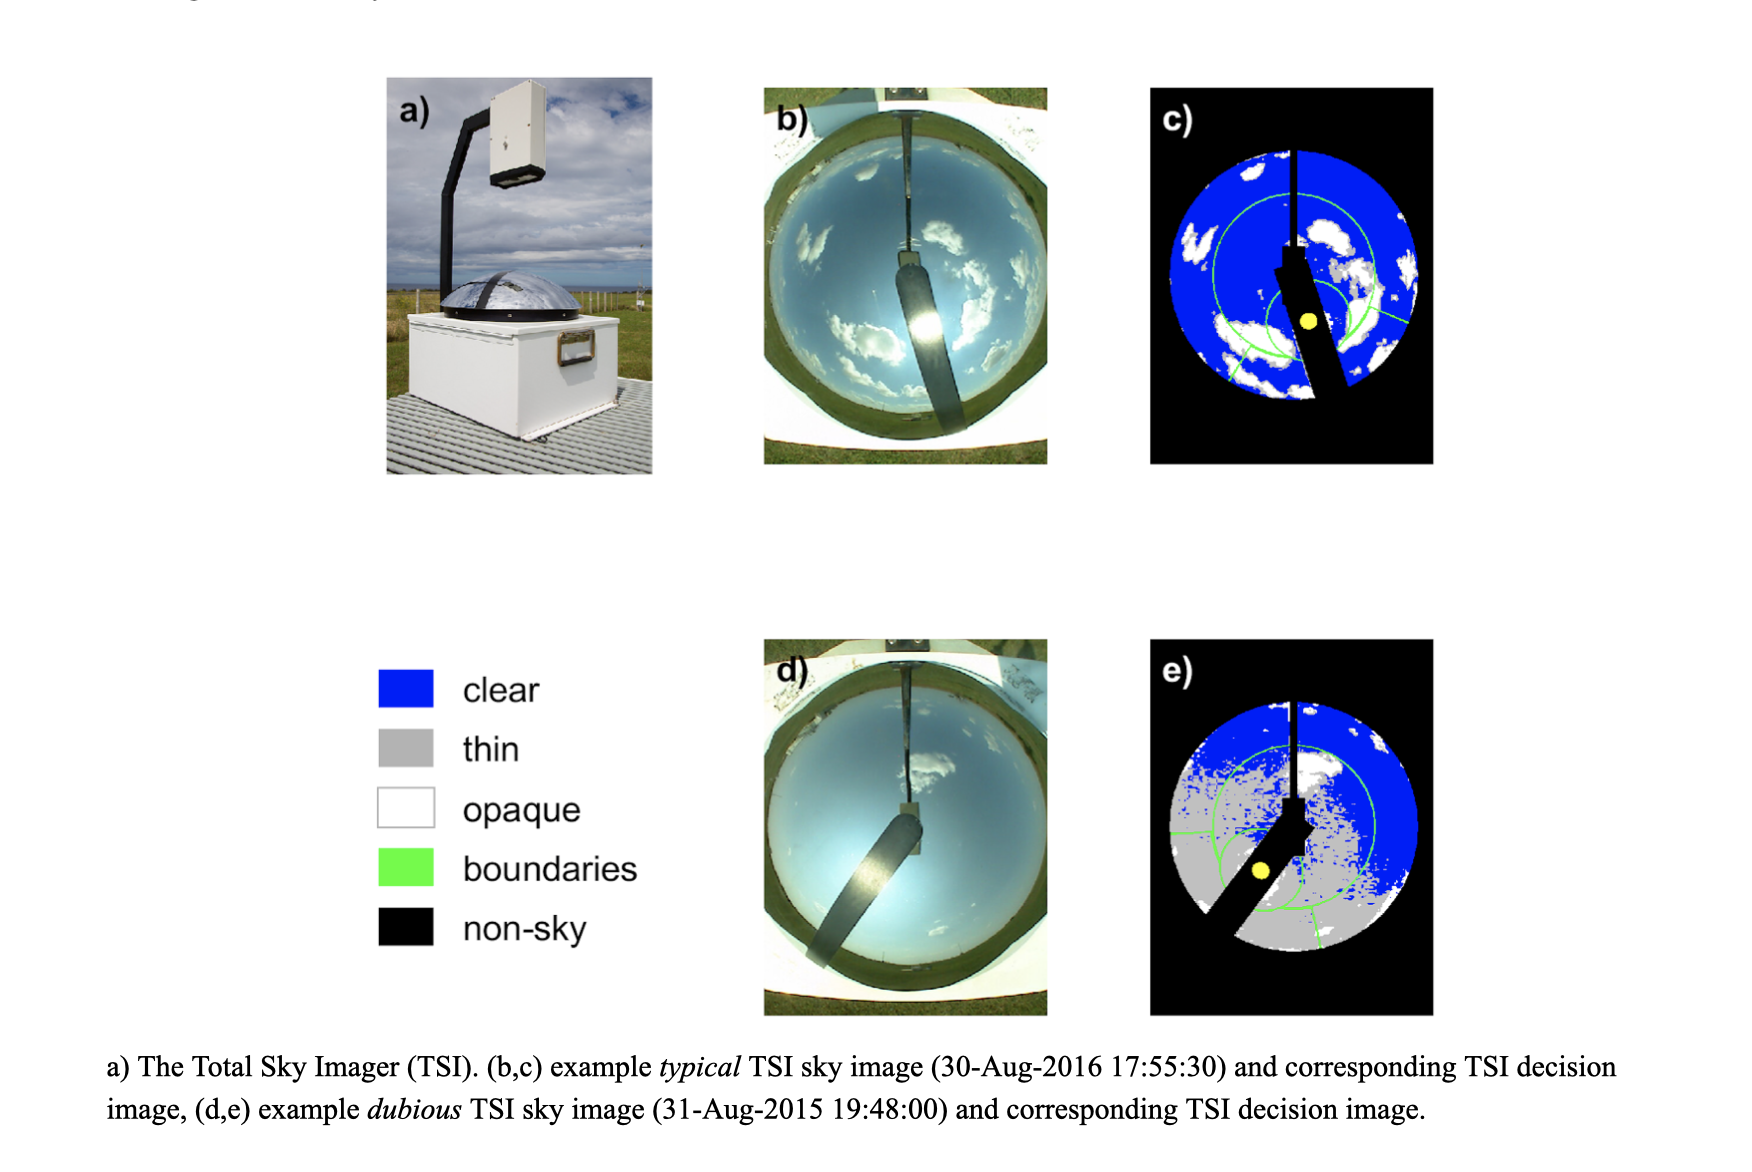
We use over one hundred thousand images from the TSI. Previous research by one of our advisers (Erin Riley) allows us to split this data into two parts: typical data and dubious data. Simply put, typical data are TSI sky/decision image pairs for which the TSI’s segmentation matches the sky image, and dubious data is the opposite (It’s more nuanced than this of course).
Our Work
We built a pipeline to prepare TSI data downloaded from ARM.gov for training, pass it through the network, and analyze the output to get a measure of the fractional sky cover.
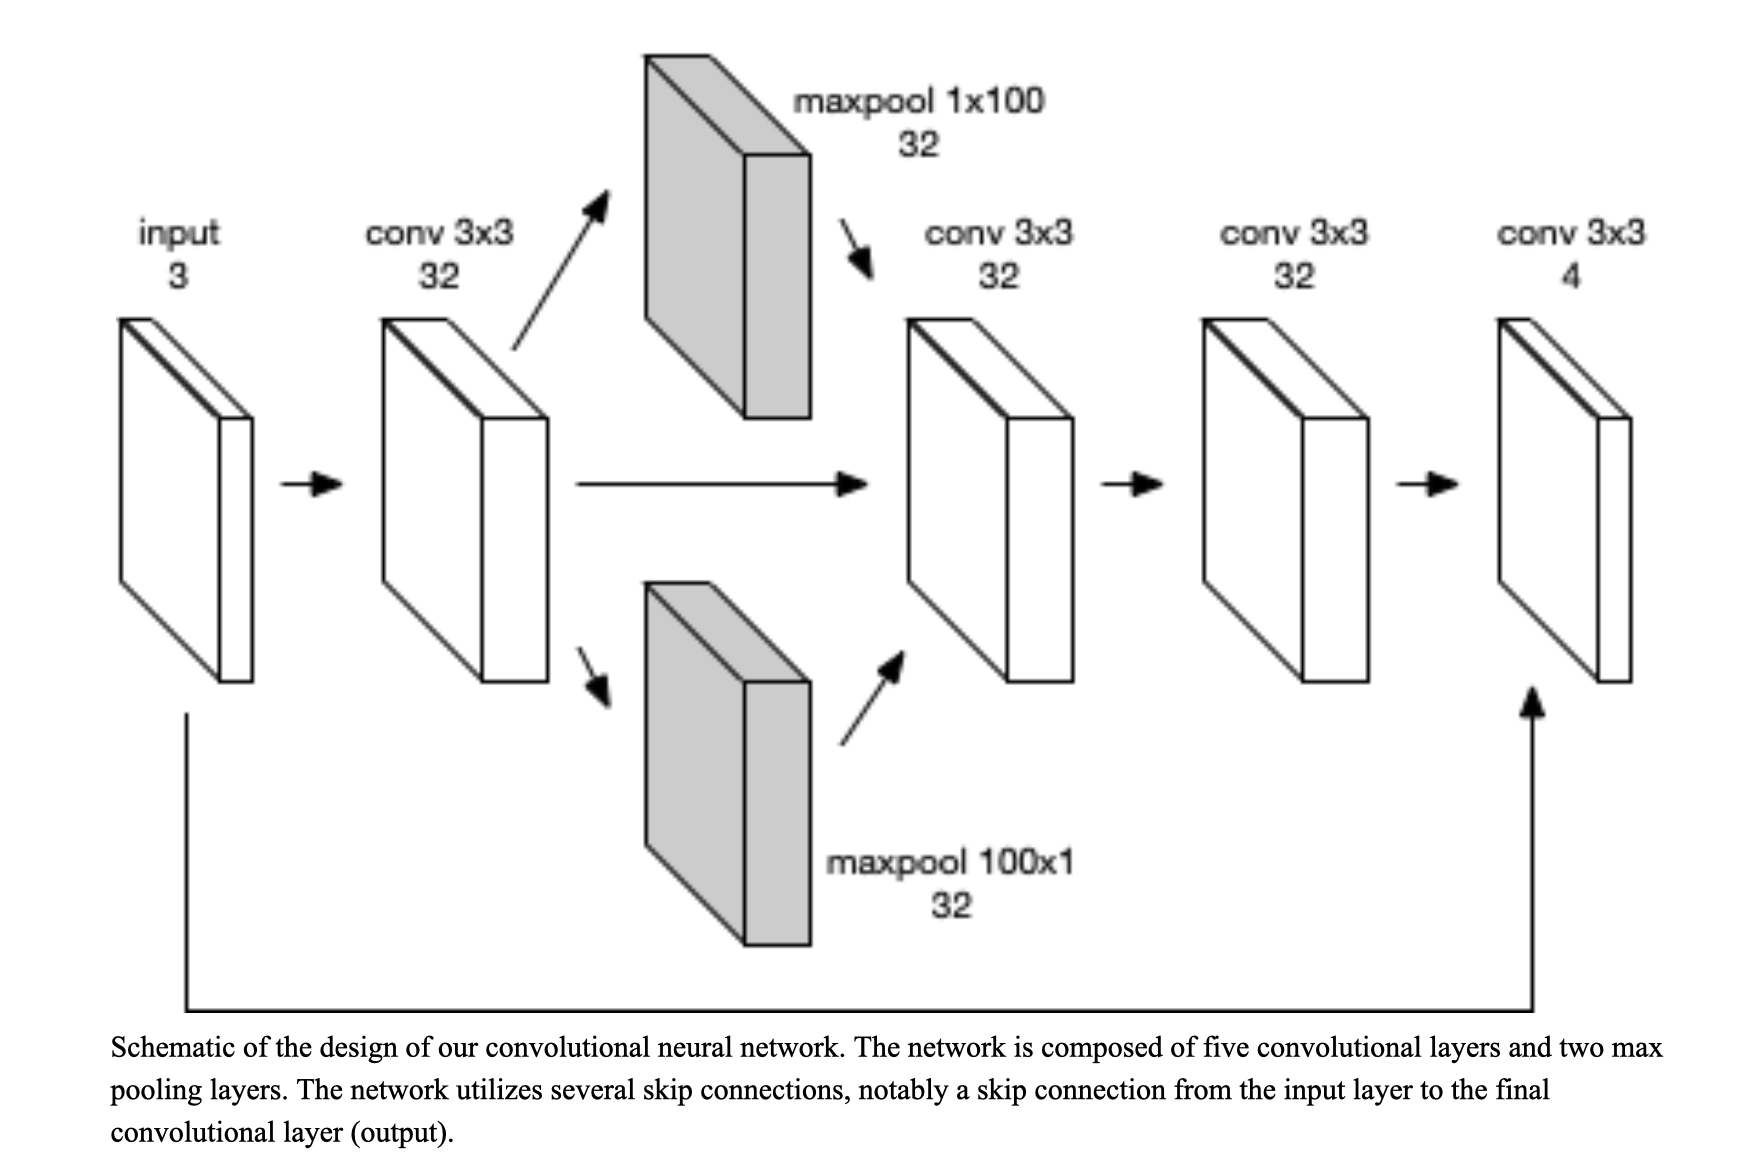
Network Design
Training
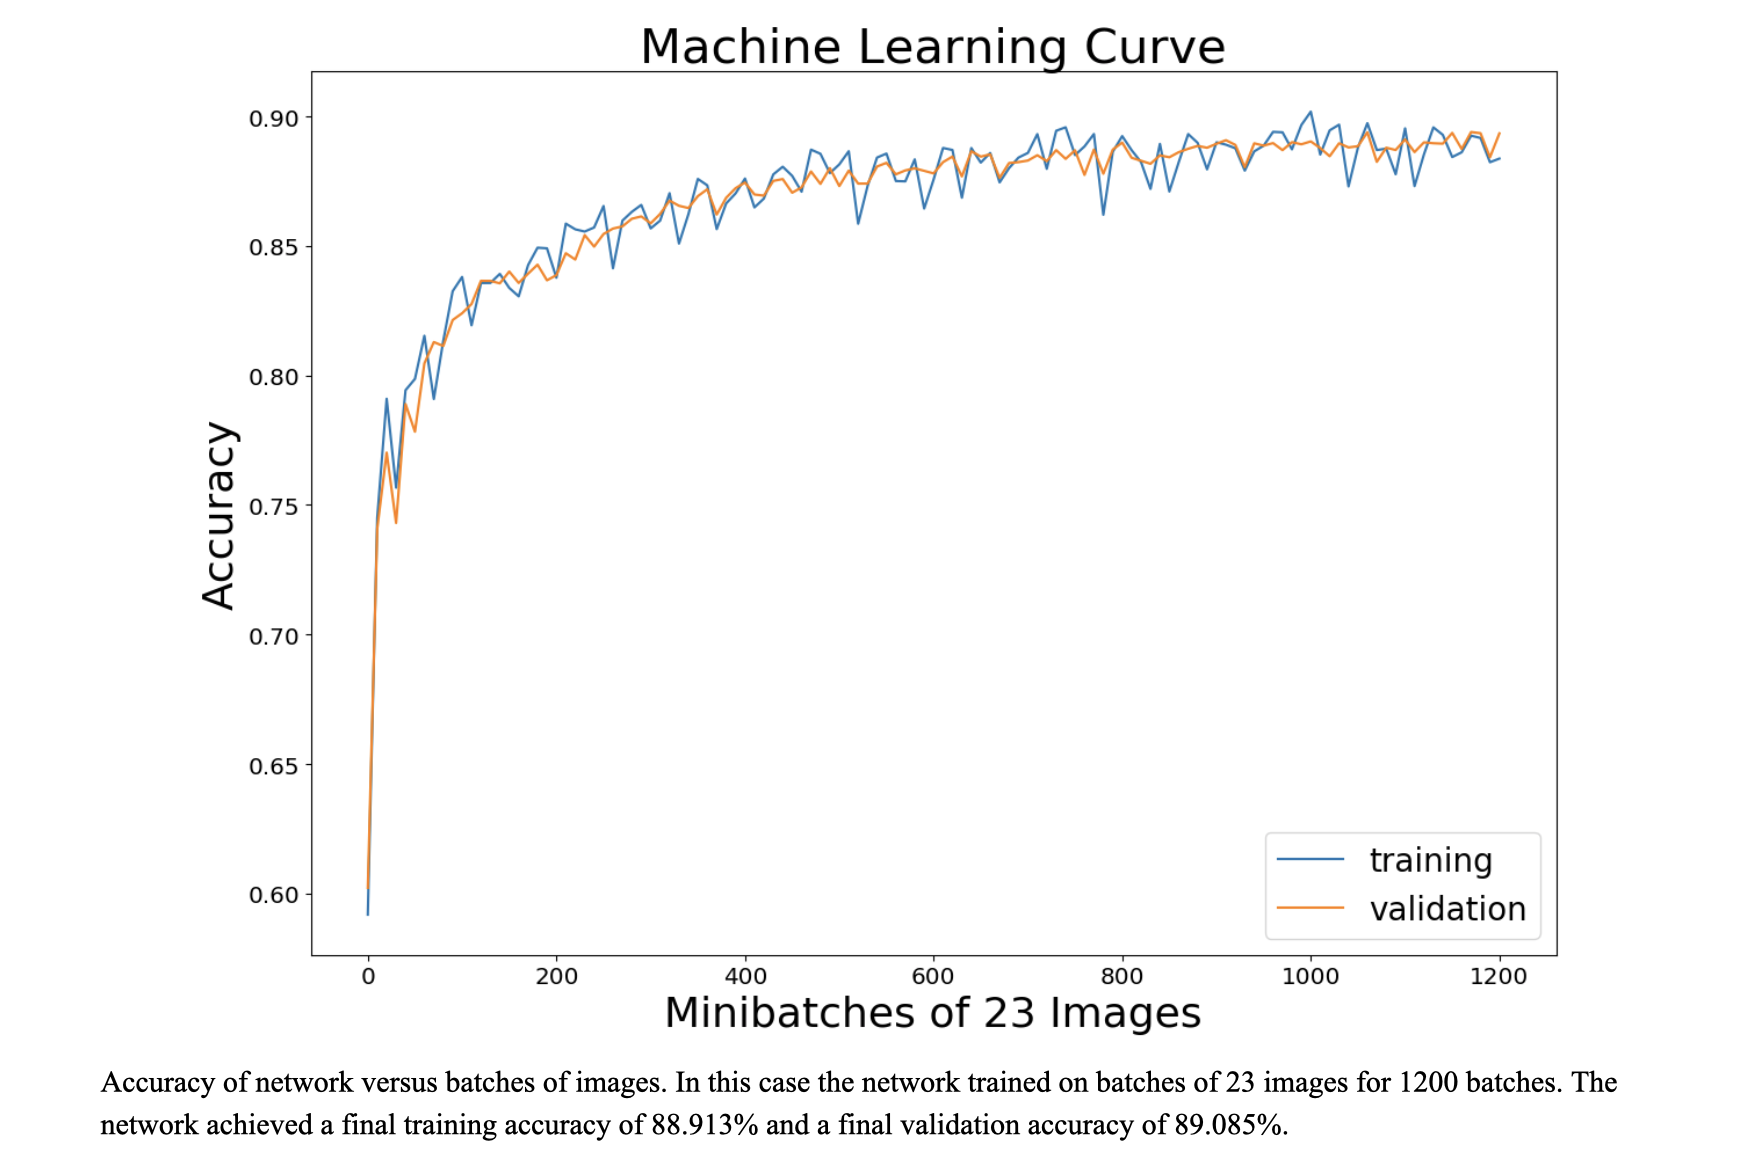
Training data is a subset of the typical data. Sky images are the inputs and decision images are the outputs. Another subset of the typical data is used for validation of the network’s accuracy.
Results
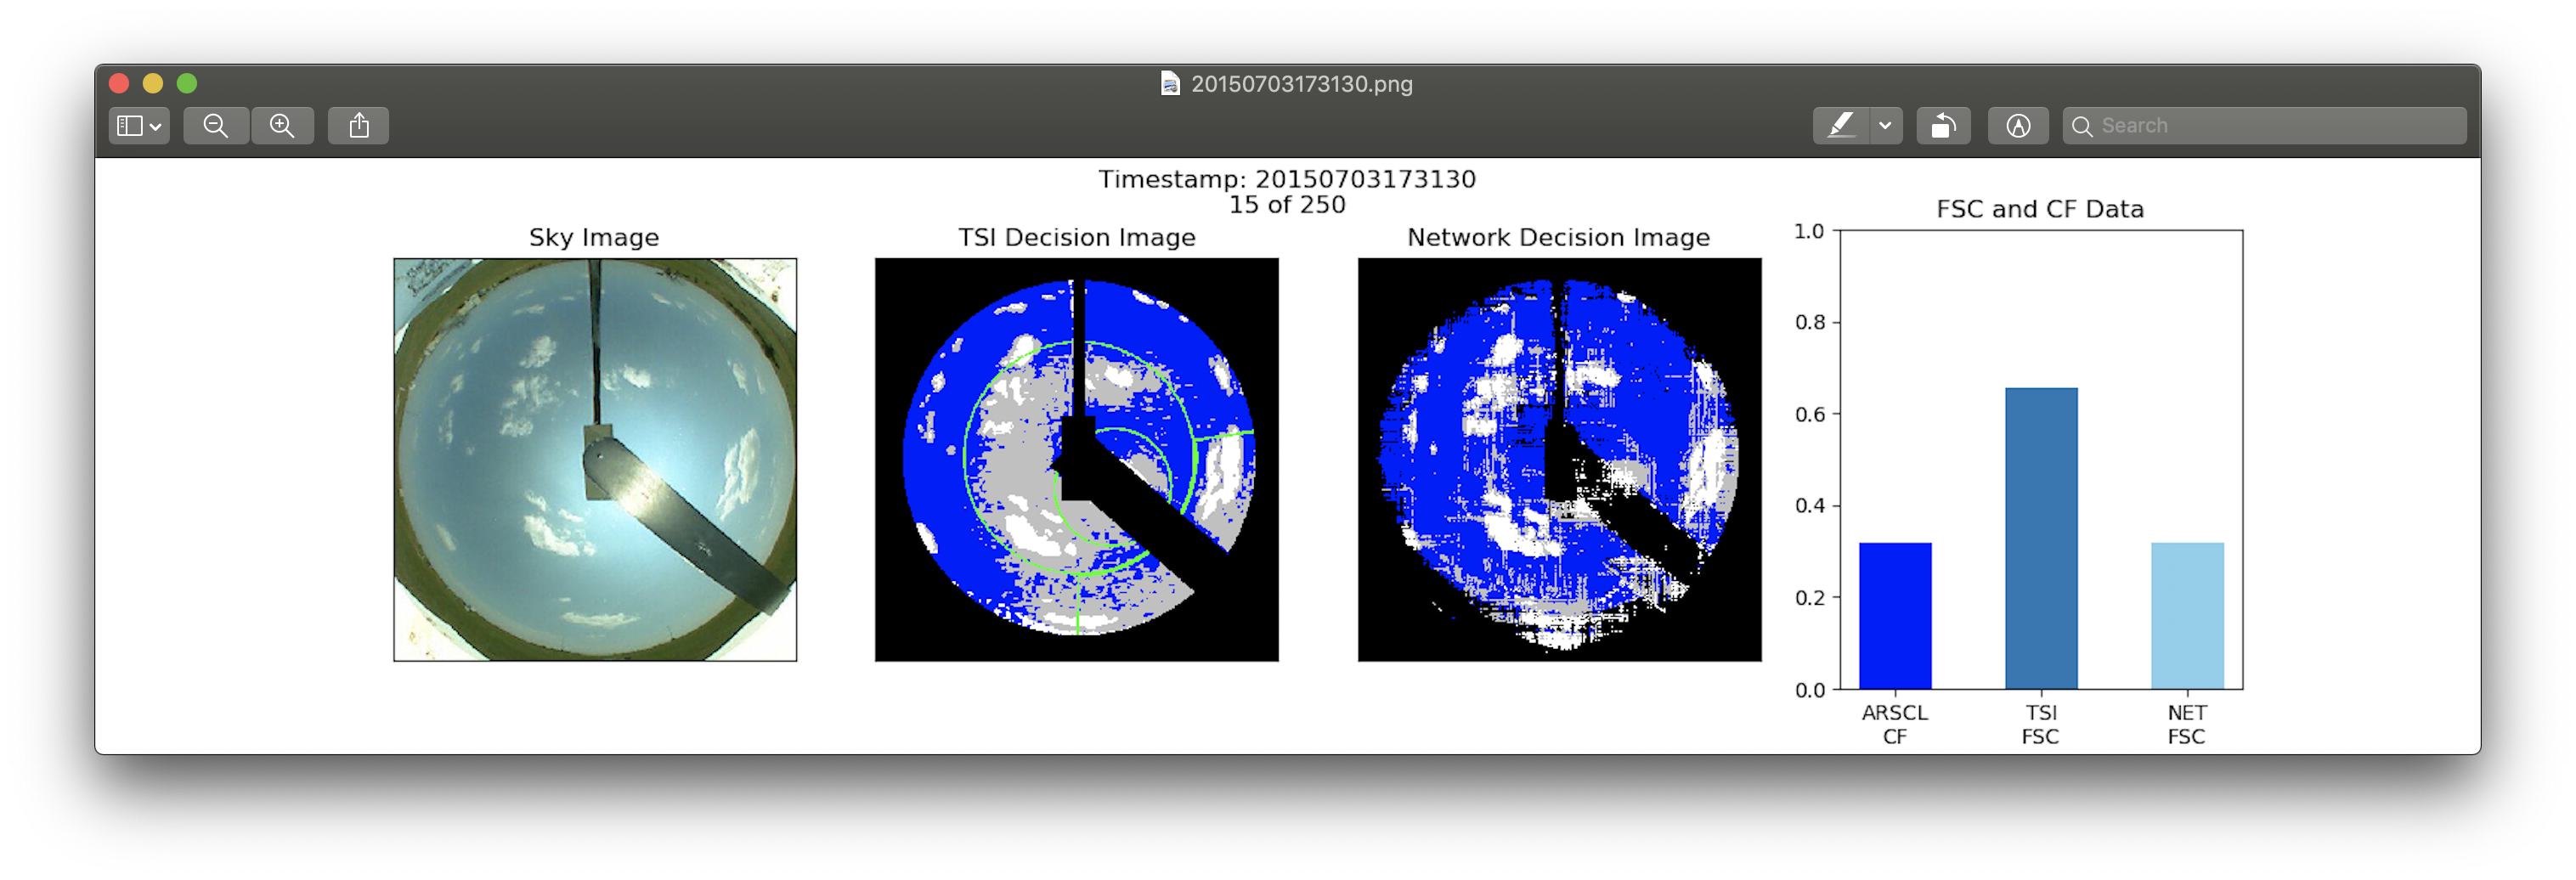
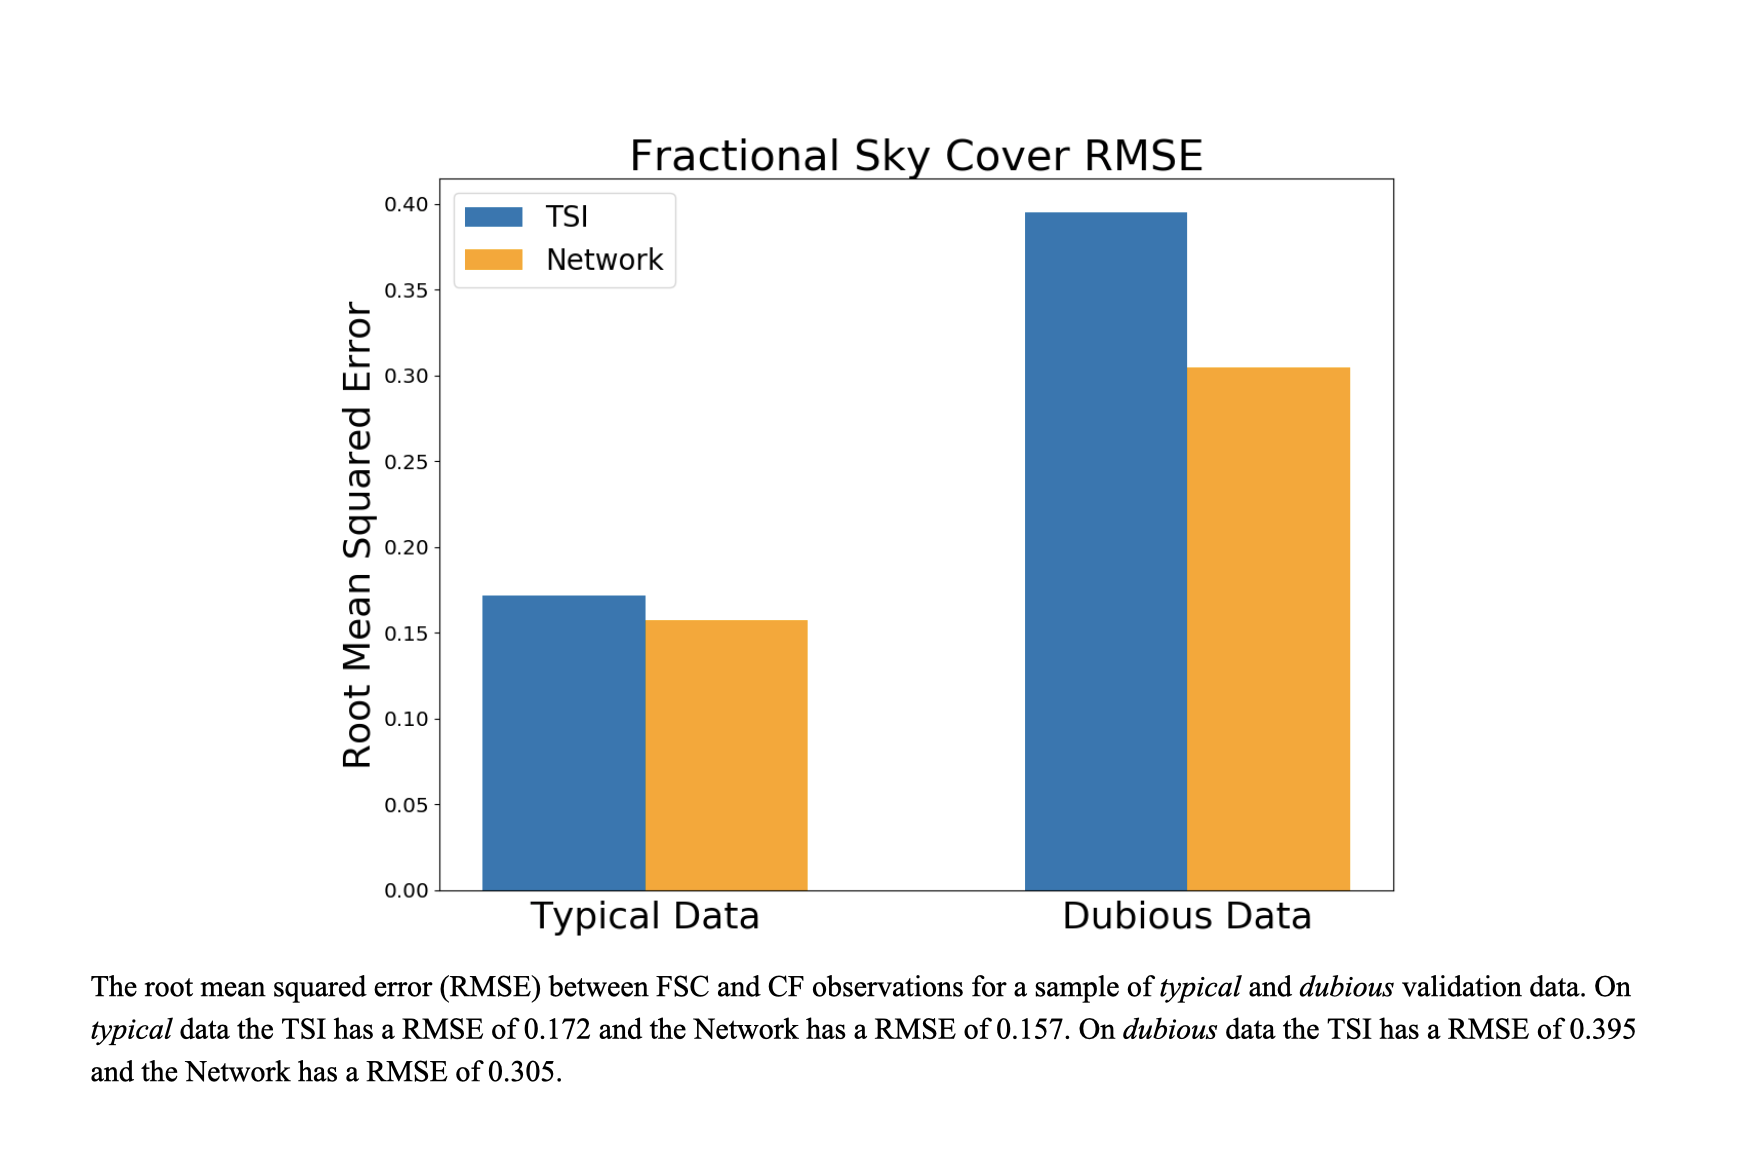
Our network does moderately well matching the TSI outputs, but we need an automated way of knowing if it does better or worse. For this we rely on the cloud fraction (CF) from an on-site laser ceilometer. We assume FSC and CF are similar enough to use for validation (Again, it is more nuanced than this).
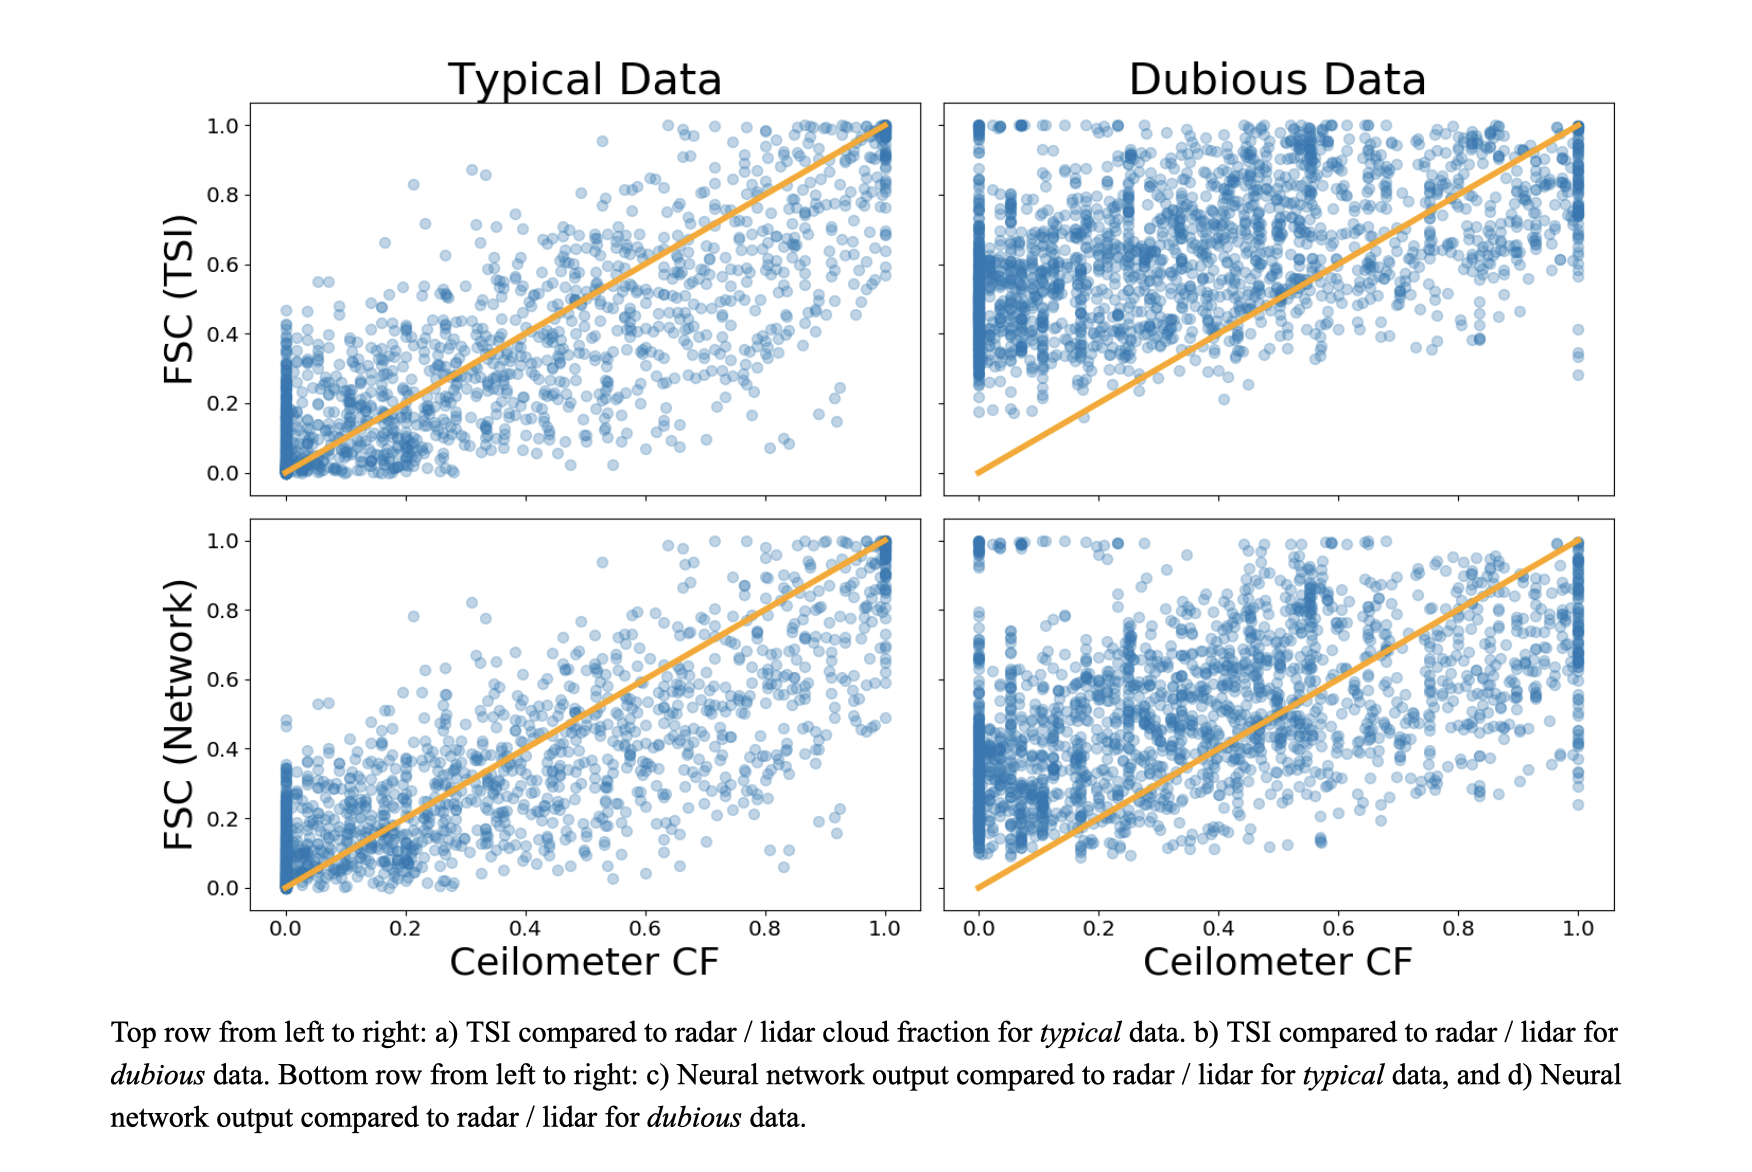
What we observe is that for typical data, our network and the TSI produce decision images that report a FSC value similar to the CF value. For dubious data, the FSC and CF are not as similar, but our network’s FSC is in better agreement with the CF. If our assumptions are valid, this indicates our network performs better than the TSI for dubious data, and perhaps overall.
Our network’s performance is slightly undermined by noise that is not present in the original sky image or TSI decision image. This noise appears in almost every decision image produced by the network. Our best guess is that the noise is due to the two skinny max pooling layers. Removing these layers causes the network to poorly approximate the black sunband, so this is a cost we must bear for now.
In the following image we see improved performance detecting thin clouds compared to the TSI but a significant amount of noise. (Black pixels are non-sky pixels, and are ignored in the computation of FSC).